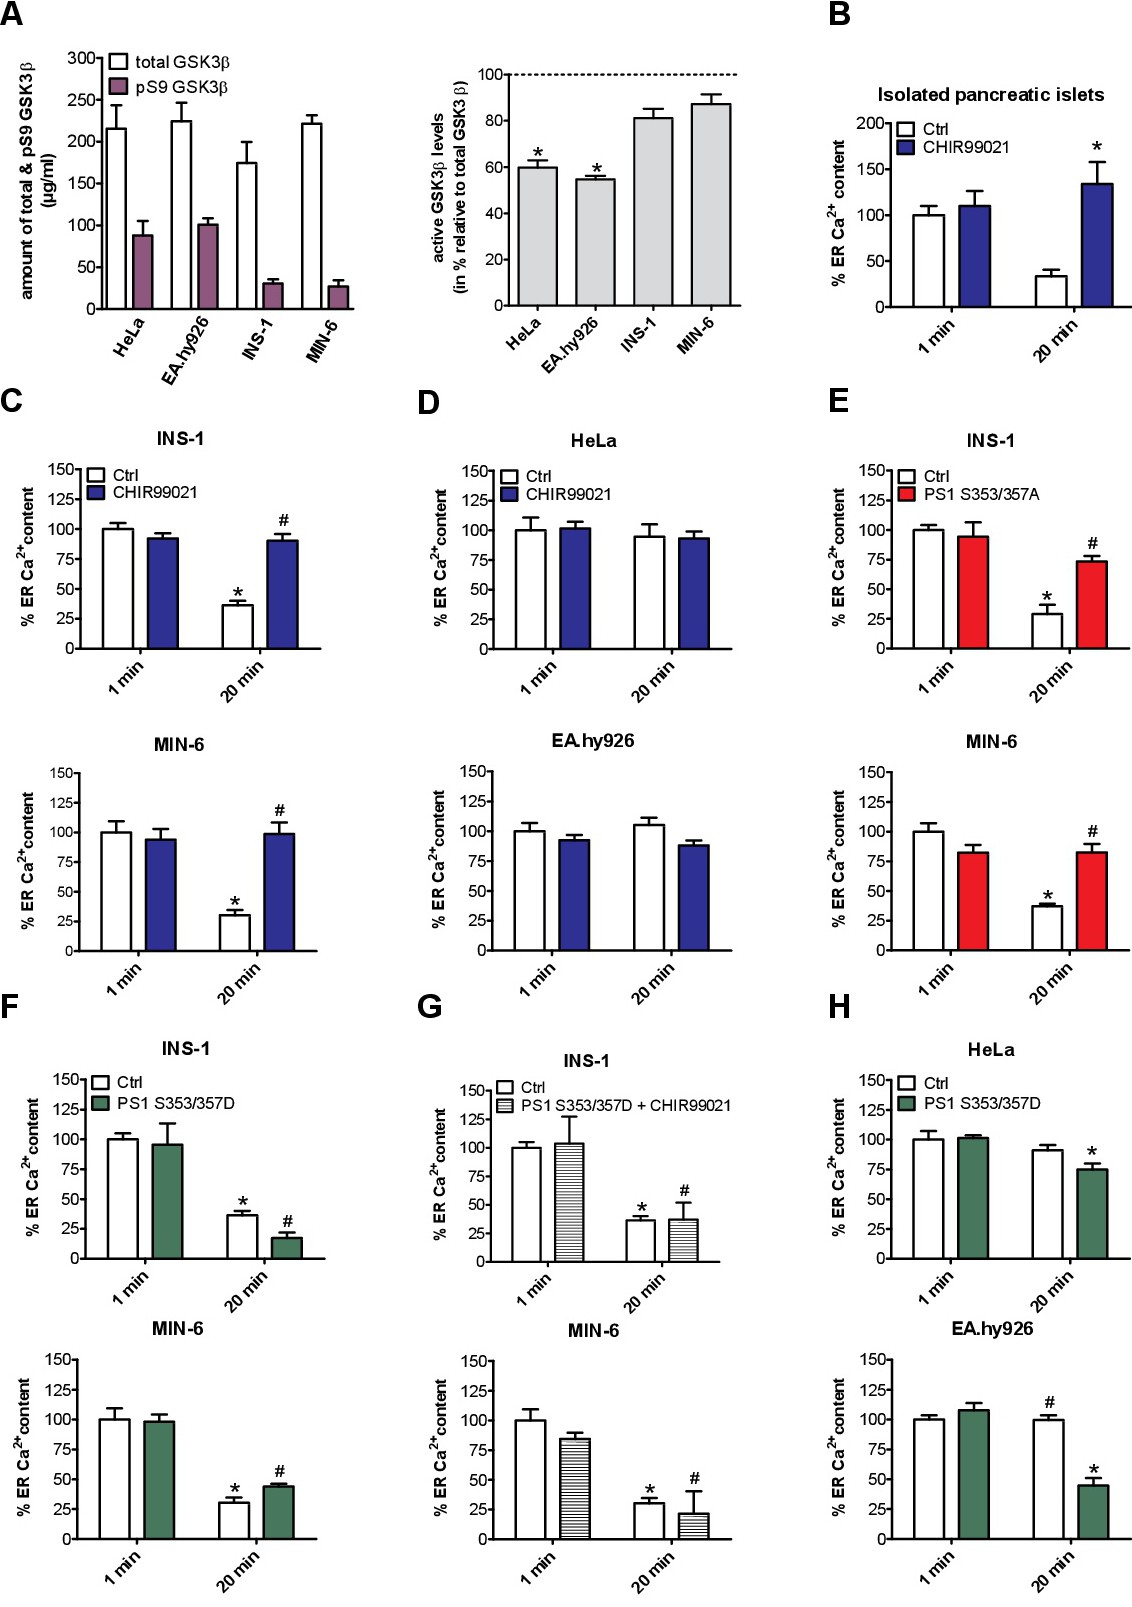
Fig. 6. GSK3β regulates presenilin-1-dependent ER Ca2+ leakage in pancreatic islets and β-cells. (A) Left panel: Quantification of the levels of total GSK3β and its inactive version pS9 GSK3β in MIN-6, INS-1, EA.hy926 and HeLa cells. Right panel: Ratio of active GSK3β versus total GSK3β in MIN-6, INS-1, EA.hy926 and HeLa cells using a specific ELISA (n ≥ 4). *p<0.05 refers to active levels of EA.hy926 and HeLa compared to β-cells. (B-H) Percentage of ER Ca2+ content in EB and after 20 min in Ca2+-free EB. At the indicated time points ER Ca2+ stores were depleted using the SERCA inhibitor BHQ (15 µM), together with histamine (100 µM) for HeLa and EA.hy926 cells or carbachol (100 µM) for INS-1, MIN-6 cells and isolated murine pancreatic islets. (B) Percentage of ER Ca2+ content in isolated murine pancreatic islets under control conditions (white bars) or after treatment with the GSK3β inhibitor CHIR99021 (2.5 µM) for 24 h (blue bars). (C) Percentage of ER Ca2+ content in INS-1 (upper panel) and MIN-6 cells (lower panel) as well as (D) in HeLa (upper panel) and EA.hy926 cells (lower panel) under control conditions (white bars) and after treatment with the GSK3β inhibitor CHIR99021 (2.5 µM) for 48 h (blue bars). (E) Percentage of ER Ca2+ content in INS-1 (upper panel) and MIN-6 cells (lower panel) under control conditions (white bars) or after overexpression of presenilin-1 mutated version which cannot be phosphorylated (PS1 S353/357A) (red bars). (F) Percentage of ER Ca2+ content in INS-1 (upper panel) and MIN-6 cells (lower panel) under control conditions (white bars) or after overexpression of a constitutively active presenilin-1 mutated version (PS1 S353/357D) (green bars). (G) Percentage of ER Ca2+ content in INS-1 (upper panel) and MIN-6 cells (lower panel) under control conditions (white bars) or after a combination of overexpression of PS1 S353/357D and treatment with 2.5 µM of the GSK3β inhibitor CHIR99021 (striped bars). (H) Percentage of ER Ca2+ content in HeLa (upper panel) and EA.hy926 cells (lower panel) under control conditions (white bars) or after overexpression of PS1 S353/357D (grey bars). Bars represent mean ± SEM. In each graph the 1 min control value was set to 100% (n ≥ 6). *p<0.05 versus respective 1 min control or as indicated in the graph using one-way ANOVA.